Some Explanations............
Carbon Offsetting is the term given to the act of doing something 'green' to
compensate for some or all of your Carbon emission and excess. This can be done
by planting trees yourself to reduce the carbon dioxide in the atmosphere, by
planting trees as a Biofuel for harvesting in ten years time, or by
generating your own renewable energy for you own consumption or to go back into the National Grid.
Most of the time that is impractical and it makes sense to leave those
onerous duties to Offsetting Companies like Carbon Earth™
, a sister company to Carbon UK
We have projects running now that should see some 20000 trees planted this
planting season with further similar projects in the planning.
It is quite simple, one offset unit represents one tonne of Carbon Dioxide
(CO2) for the current year. That offset is allocated to you for ever but further
offsets will be needed for subsequent years. So on it goes, however large or
small your offset is, every bit helps the planet.
....................................................
By planting trees and growing biofuels we are able to provide carbon offsets
for Individuals, Households and Companies to buy. That action allows us to plant
more and more!
The idea of paying for emission reductions elsewhere for your carbon footprint
excesses is well known from the closely related concept of emissions trading.
However, in contrast to emissions trading, which is regulated by a strict formal
and legal framework, carbon offsets generally refer to voluntary acts by
individuals or companies and are commonly arranged by commercial
providers.
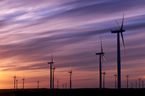
A wide variety of offset methods are in use — while tree planting has initially
been a mainstay of carbon offsetting, renewable energy and energy conservation
offsets have now become increasingly popular.
Carbon offsetting can be part of a "carbon neutral" lifestyle and has gained appeal
among the energy consumers in western world. We are becoming increasingly aware
of the negative effects of our energy demanding
lifestyles are having on the environment. The Kyoto Protocol has sanctioned
official offsets for governments and private companies to earn carbon credits
which can be traded on a marketplace. This has contributed to the increasing
popularity of voluntary offsets among private individuals and also companies.
Offsets are not an option to reducing your consumption but in our view every effort should be made to reduce your
emissions both as a way 'doing your part' as well as saving money on your energy
requirements.
Back to
Carbon Footprint Calculator
This is a very complex study and one that is still open to debate. However if you would like to follow this through please click on this link
Defra Conversion Tables
and go to page nine.
We have used an average base on broad based assumptions but they are in line with most calculations.
Our Calculator refers to return flights i.e. a return flight to Paris form
London and back is one unit. Back to
Carbon Footprint Calculator
If we were to take in the entire world the average production of Carbon
Dioxide is approximately 3 tonnes per head of population. In the western world
it ranges between ten and twenty five tonnes per head of population. In the UK
we are told that the average is 10.92 tonnes per head of population with
Government moves to reduce this number by 20% to 8.74 tonnes by 2012 and by 60%
to 4.34 tonnes by 2050.
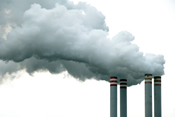
The problem is that even at that reduced level we are heavily polluting our
environment plus we are going to run out of fossil fuels such as oil and coal.
It is estimated that a sustainable level of Carbon Dioxide CO2 emission for
the 6 billion people is 2 tonnes per head of population and that is assuming the
population remains constant. So at the UK's rate of pollution we would need 5
worlds to sustain us. Whatever you make of the statistics we need to achieve
much now. Every little helps.
Back to Carbon Footprint Calculator
Some explanations towards understanding Industry and Lifestyle Emissions
This part of the calculator is very complex and has to be seen as an
'informed assessment' . A large amount of work has been carried out by a variety of
industry and governmental bodies to assess the individual impact without duplication with other
usage calculations. We have used three tonnes per capita as an average which is most probably lower than
the actual. Read below for more explanation if you wish.
The National Energy Foundation states that "around half UK CO2 emissions come from industry and commerce supporting our everyday lifestyle"
(www.natenergy.org.uk/comment.htm).
This means producing our food, clothes, consumables, and maintaining our national infrastructure. National average annual
CO2 emissions per capita are 10 tonnes, so our average "industry and commerce emissions share" is 5 tonnes each.
Part of industry & commerce provides infrastructure and resources that benefit everyone, and part of it provides the goods of "consumerism". We may all take a share of the
CO2 produced by the former, and the latter can be shared out according to consumption, which is largely linked to income. Public services and essential industries including health, education, defence, agriculture and construction produce 23% of industry & commerce CO² emissions. "Domestic consumption" including cars, recreation, electrical goods, clothing, and consumables account for 40% of industry & commerce emissions. "Trade" including wholesale, garages, showrooms and computer activities accounts for 7%. And heavy industry, including mining and the material production, accounts for 30%.
In our estimations we have already accounted for 3 tonnes of the 5 tonnes of
CO² per person in our personal carbon footprint calculations. So in the interest
of not double counting, we have allocated the remaining 2 tonnes to the
employers.
Having read the above, please therefore make the estimations you feel happy with. However, in a society where most products and services are provided with the help of fossil fuels, it may be surprising how close the correlation is between income (or more accurately, expenditure) and CO2 emissions. The aim of this calculator is to aid in reducing emissions. Simply being aware of CO2
factors associated with industrial products should help toward this end.
Back to
Carbon Footprint Calculator
Carbon dioxide is incorporated (sequestration.
Literal Meaning. Removal or separation, a withdrawal into seclusion.) into forests and forest soils by trees and other plants. Through photosynthesis, plants absorb carbon dioxide from the atmosphere, store the carbon in sugars, starch and cellulose, and release the oxygen into the atmosphere.A young forest, composed of growing trees, absorbs (sequesters) carbon dioxide and acts as a sink.
Mature forests, made up of a mix of various aged trees as well as dead and decaying matter, may be carbon neutral above ground. In the soil, however, the gradual build-up of slowly decaying organic material will continue to accumulate carbon, but at a slower rate than an immature forest.
Organic material in the form of humus in the forest floor accumulates in greater quantity in cooler regions such as the boreal and taiga forests. At warmer temperatures humus is oxidized rapidly; this, in addition to high rainfall levels, is the reason why tropical jungles have very thin organic soils.
The forest eco-system may eventually become carbon neutral. Forest fires release absorbed carbon back into the atmosphere, as does deforestation due to rapidly increased oxidation of soil organic matter.
The dead trees, plants, and moss in peat bogs undergo slow anaerobic decomposition below the surface of the bog. This process is slow enough that in many cases the bog grows rapidly and fixes more carbon from the atmosphere than is released. Over time, the peat grows deeper. Peat bogs inter approximately one-quarter of the carbon stored in land plants and soils.
Back to
Carbon Footprint Calculator
The British Government has undertaken to reduce
the personal emissions from the present day 10.92 tonnes CO² per
capita by 20% by 2012. This will make the personal annual target per head of
population 8.74 tonnes CO2.
Back to
Carbon Footprint Calculator
The Carbon Trust
has found that on
average the UK uses products and services with a total footprint of 648 million
tonnes of carbon dioxide (CO²) emissions each year. This means that the average
Briton’s annual carbon footprint is 10.92 tonnes of CO², which can result from
products they buy, leisure activities, travelling and heating their homes
amongst others.
People are becoming more aware about product carbon footprints, presenting an
opportunity for businesses to meet the demands of their customers and start to
lead the way in reducing carbon emissions.
Back to
Carbon Footprint Calculator
Much talk and calculation has gone into producing accurate numbers for
emissions for cars. Driving cars, vans, 4 x 4s or anything for that matter burns
fossil fuel and leaves Carbon Dioxide behind. Below is an extract from a recent
report on the way the European Union is viewing the situation and what there
expectations are.
For the purpose of our Carbon Footprint Calculator we have used the 'average
car' with emission profile of 163g/km of CO². This converts to 261g/mile
of CO².
If you know the emissions of your vehicle(s) then enter more or less miles to
compensate.
We can make this sector as complicated as is necessary, but the idea is to
keep it simple.
Press Extract
'New Scientist'
February 07
A proposal to enforce limits on the emissions of new cars and vans
sold in the European Union has finally been put forward by the
European Commission (EC) after a two-week delay. The legislation,
if adopted by member states, would make it mandatory for new cars
sold in the EU to produce on average 120 grams of carbon dioxide per
kilometre travelled by 2012. Vehicles currently emit an average of
163 g/km.
The move follows the poor performance with regard to voluntary
targets set in 1999. At the time, European carmakers were asked to
reach a 140 g/km target by 2008, while Japanese and Korean
industries were set the same target for 2009.
An October 2006 report by the European Federation for Transport
and Environment found that only Fiat, Citroen, Renault, Ford and
Peugeot were on track to meet the target.
"The strategy has brought only limited progress," said the EC on
Wednesday. Between 1995 and 2004, average emissions for new cars in
the EU fell from 186 g/km to 163 g/km.
Back to
Carbon Footprint Calculator
|